Uncovering Critical Infrastructure Data Through Geospatial Analysis
Textron Systems worked with the city of Durham, North Carolina to support its storm water runoff prevention strategy through object-oriented feature extraction.
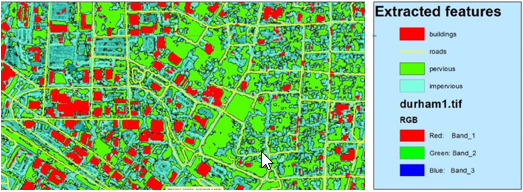
For more than a decade, Durham, North Carolina's Public Works GIS Group has used Textron Systems Geospatial Solutions' Feature AnalystTM to identify and delineate new impervious surfaces within the city limits. Automated feature extraction has enabled the Public Works GIS Group to process and analyze data more efficiently, at a higher level of accuracy, and on a much larger scale than through manual processing.
The organization’s Geographic Information Systems (GIS) Analysts use the impervious layer for a number of analytical tasks, most notably to assess storm water runoff potential and identify areas that are most vulnerable to flooding. They also compare this layer to their pervious layer, which shows how much green space is currently within the city. Green space is critical in storm water management, because it counterbalances impervious runoff by absorbing large amounts of water.
As a result, automated feature extraction saves the department valuable time on updating its impervious coverage map each year, an enormous and labor-intensive task with the city covering over 280 square kilometers. Automating this process has allowed the department to update the layer more frequently and with greater accuracy.
Despite this success, the Public Works GIS Group has contended with challenges related to the base imagery used to conduct the analysis. Over the years, the city and the Public Works GIS Group have used a commercial imagery vendor that only collects the data once per year, meaning updates can only be performed annually. In addition, cost, total turnaround time and image resolution also are factors.
In 2016, the team started exploring the use of a cloud-based imagery service provided by Nearmap Inc. as a possible solution for some of these problems. Nearmap data was attractive because it is collected biannually at 0.1-0.2 centimeters per pixel, and is much more cost effective. With multiple collections per year and an option to do additional collections with a turnaround time of two weeks, the city would be able to save money, analyze and update their impervious data more often, and produce a more accurate product.
Despite these potential benefits, the department was concerned about switching from its existing four-band imagery to a three-band product because it could have a profound effect on the accuracy of their feature extraction results. Up to this point, the Public Works team had been using four-band imagery, including an infrared band. Over the years of using the Feature Analyst suite, Public Works GIS analysts found that this infrared band helped Feature Analyst properly distinguish between the gravelly, granitic surfaces typical in their region and impervious surfaces. Without the infrared band, granitic surfaces have a very similar spectral signature to impervious areas, increasing the potential for misclassification and false positive results because it is difficult for feature extraction algorithms to separate the classes. Understandably, the Public Works GIS Group was concerned about switching back to three-band imagery and making dramatic changes to a time-tested and reliable workflow.
In 2016, the Public Works GIS Group’s Program Manager and Nearmap reached out to Textron Systems Geospatial Solutions, the makers of Feature Analyst, to see if a joint proof of concept could be conducted to test the Nearmap solution and alleviate some of the concerns of Public Works. Nearmap offered to provide Textron Systems with full access to its data holdings, while the Public Works GIS Group agreed to provide parcel data, its existing impervious layer, and workflow guidance to help Textron Systems develop the proof of concept.
Textron Systems used a city boundary shapefile for guidance to define a test area of five square kilometers within city limits, and then clipped out a stack of sample data from Nearmap’s online holdings that ranged from 2014 to 2016. Next, Textron Systems replicated the GIS Group’s existing workflow model on the 2014 dataset, then began preliminary tests to analyze results and modify the workflow along the way. To assess quality and accuracy, random sampling was chosen as the quality control method to validate the results. To test the fidelity of the feature extraction model, the model was applied to the data from 2016 to ensure that it was consistent with the 2014 results.
The final test results yielded 190 new impervious surface polygons identified through automated feature extraction. To verify accuracy, 50 of the 190 results were randomly selected for visual inspection and then individually marked in the attribute table as either correct, incorrect, possible or other. The results of the quality assessment yielded the following statistics.
- 37 correct results for new impervious areas
- 7 possible results for new impervious areas that would need further verification
- 5 incorrect results
- 1 water feature
Based on these results, Public Works could expect to achieve an approximate accuracy rate of 85-90 percent using Nearmap imagery and Feature Analyst.
To measure performance, the total quality control time, or the time it took to perform random sampling which was 15 minutes, was added to the total extraction time of one minute and then rounded up to 20 minutes per five square kilometers. This averaged out to be approximately four minutes per square kilometer for a preliminary result. Based on this proof of concept, the city was pleased with the results and decided to move forward with its transition to Nearmap data.
These results demonstrate the potential of automated feature extraction to accomplish a task that would normally take days or weeks in mere minutes. In addition, it provides a real-world example of a collaborative relationship between the imagery vendor, software developer and end user to develop a robust solution for all parties involved. Each player serves as an expert in their own domain, while at the same time learning from the others to create a capability that can be built upon over time.