Hyperspectral Detection
Textron Systems’ new and innovative Hyperspectral Detection looks across spectral bands to automatically locate targeted materials with precision. Hyperspectral Detection accurately locates specific materials, beyond what is visible to the naked eye, by optically scanning a scene and examining the spectral reflectivity signatures imparted by specific chemical compositions.
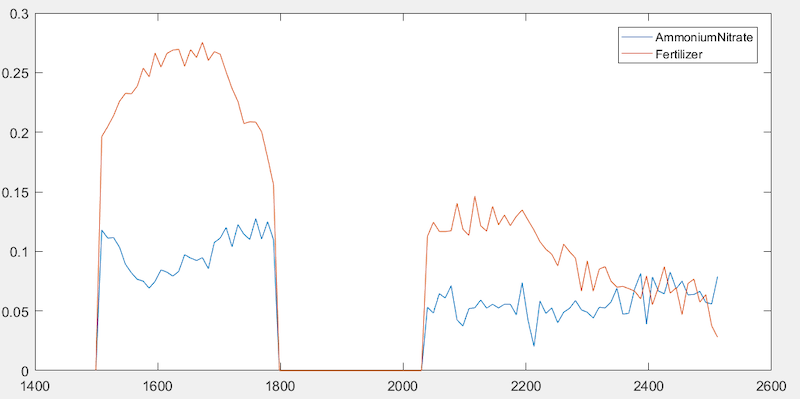
Figure 1: Material Reflectivity vs Wavelength forms a Spectral Signature by which specific materials can be reliably identified.
Hyperspectral imaging is a technique for analyzing the chemical composition of objects in a scene. It works by providing fine grain spectral resolution behind each pixel, and looking for “fingerprint” spectral features that arise from the molecular characteristics of the materials in the scene. The human eye perceives color in visible light as a combination of three primary wavelengths (Red, Green, Blue, with roughly 100 nm resolution, from 400 to 700 nm). However, Textron Systems’ Hyperspectral Detection offers 10 to 100 times finer resolution. The finer resolution allows the identification of molecular signature characteristics that are not perceivable to the human eye.
Textron Systems initial offerings for Hyperspectral Detection use the Short Wave Infra-Red (SWIR) band. The SWIR band covers wavelengths between 0.9 micron and 2.5 micron, and is generally considered the optimum band of wavelengths for material analysis missions. The SWIR band covers a wide range of potential applications, such as detection of explosive compounds, detection of corrosion, detection of chemical changes in materials over time.
Hyperspectral imagery produces a huge volume of data that has usually required human analysts to interpret. The spectral correlation algorithms cover more than 150 different wavelengths and run on a per-pixel basis, with hundreds of thousands of pixels in a scene. The Textron Systems Hyperspectral Detection uses embedded automated detection processing to eliminate the need for human data analysts. The technology is forward thinking and fully effective to extract results in real time.
In hyperspectral analysis, chemical "Fingerprints" are encoded as material reflectivity, which usually cannot be directly measured. The signal produced at each pixel of the spectrometer is luminous intensity, which is the product of material reflectivity and the illumination, which is often unknown. In order to extract results, the illumination must be factored out, leaving the material reflectivity as the detection signature.
The illumination is often an unknown, and this is what complicates the analysis. Traditional analysis methods attempt to estimate the illumination by iteratively processing the entire image, using the statistical distribution of many different materials to develop an average estimate of the illumination. There are two problems with this approach. First, there is no guarantee that the illumination is uniform across the scene. In most cases, it is not (due to shadowing effects). Second, the iterative processing of an entire image is slow, and does not lend itself to automation.
Textron Systems has found a solution to this issue by developing a real-time, embedded processing capability to eliminate the human analysis, and thereby enable automatic declarations. The emphasis is on non-iterative matrix regression (NMR) algorithms, with parallel processing replacing iteration. The detection results presented below are examples of NMR detection processing.
.png)
The different chemical signatures are illustrated in Figure 2. The picture shows the placement of target samples, interleaved with non-target control samples. In this case, the target of interest was ammonium nitrate (34-0-0 agricultural fertilizer) in sandwich bags. The non-target control samples were 28-0-3 lawn fertilizer in sandwich bags (chemically and visually similar to the ammonium nitrate samples).
The bottom picture is the same image, processed to search for the ammonium nitrate spectral signature. The target samples are correctly identified (highlighted in red), and there are no false alarms in the image. Intuitively, one might expect the two chemistries to be difficult to differentiate.
- Both are high in nitrogen (34% vs 28%).
- Both have zero percent phosphate.
- Both are low in potassium (0% vs 3%).
And yet, the spectral signatures (Figure 2) are completely different, allowing the ammonium nitrate agricultural fertilizer to be consistently discriminated from the lawn fertilizer.
With Textron Systems’ Hyperspectral Detection, for the first time, immediately see the invisible.